Drought & Wildfire

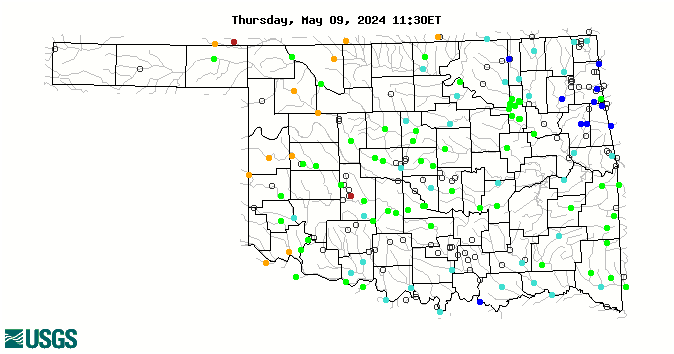
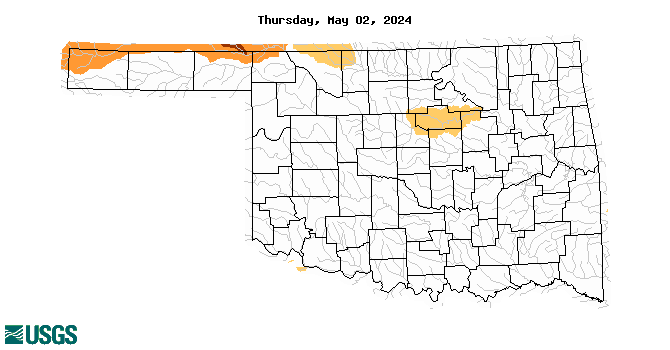
Current Drought & Wildfire Conditions

Rainfall summaries by climate division (tables & maps) learn more

Rainfall summaries by climate division (tables & maps)

Tables of rainfall summaries for each climate division are available. Separate summaries are provided for the differing durations of rainfall: from spring to the current date, the warm growing season, the beginning of the calender year to the current date, the water year through the current date, and the last 30, 60, 90, 120, 180, and 365 days.
Reservoir Levels and Storage learn more

Reservoir Levels and Storage

This map is updated regularly by the Oklahoma Water Resources Board.
Oklahoma burn bans learn more

Oklahoma burn bans

The Oklahoma Forestry Services' Current Burn Bans map indicates the counties that have declared a burn ban, as well as bans declared by the Governor. The county and dates for which the ban is valid are listed beneath the map.
U.S. Drought Monitor - Oklahoma learn more

U.S. Drought Monitor - Oklahoma

The map displays weekly drought conditions, as designated by experts including climatologists at the Oklahoma Climatological Survey. The data cutoff for Drought Monitor maps is Tuesday at 7 a.m. Eastern Standard Time. The maps, which are based on analysis of the data, are released each Thursday at 8:30 a.m. Eastern Time.
U.S. Drought Monitor learn more

U.S. Drought Monitor

The map displays weekly drought conditions, as designated by experts including climatologists at the Oklahoma Climatological Survey. The data cutoff for Drought Monitor maps is Tuesday at 7 a.m. Eastern Standard Time. The maps, which are based on analysis of the data, are released each Thursday at 8:30 a.m. Eastern Time.
Drought Impact Reporter learn more

Drought Impact Reporter

Information for the impact report database comes from a variety of sources: on-line news stories, members of the public who submit a drought-related impact for their region (see Add A Drought Impact), members of the media, and members of government agencies.
Consecutive days with less than 0.10 inches of rainfall learn more

Consecutive days with less than 0.10 inches of rainfall

This Oklahoma Map displays the number of consecutive days an area has experienced less than 0.10 inches of rain. The values lead up to the current date.
Consecutive days with less than 0.25 inches of rainfall learn more

Consecutive days with less than 0.25 inches of rainfall

This Oklahoma Map displays the number of consecutive days an area has experienced less than 0.25 inches of rain. The values lead up to the current date.
Oklahoma Keetch-Byram Drought Index learn more

Oklahoma Keetch-Byram Drought Index

The Oklahoma Keetch-Byram Drought Index illustrates the probability of wildfires based on drought and soil moisture conditions throughout Oklahoma for the current day. It ranges from 0 (no drought) to 800 (extreme drought).
Flood & high flow conditions from the USGS learn more

Flood & high flow conditions from the USGS

The Flood and High Flow map produced by USGS shows the location of streamgages where the water level is currently at or above flood stage, or at high flow. The high flow conditions are expressed as percentiles that compare the current immediate flow value to historical daily average flow values for all days of the year.
Streamflow conditions from the USGS learn more

Streamflow conditions from the USGS

Map of real-time streamflow compared to historical streamflow for the day of the year.
Departure from normal streamflow from the USGS learn more

Departure from normal streamflow from the USGS

Departure from Normal Streamflow from the USGS provides detailed drought information. A map of your chosen state shows areas that have experienced below normal streamflow (in percentile classifications) based on a historical seven day average for that particular day.

Other Drought & Wildfire Resources

  • Oklahoma State University Drought Resources

    Fact Sheet Resources from OSU Extension on Drought

  • Oklahoma Water Resources Bulletin

    Every month, the Oklahoma Water Resources Bulletin produces a summary on Oklahoma's current conditions. Precipitation, soil moisture, drought indices, a weather/drought forecast, a crop report, reservoir storage, and streamflow conditions are included.

  • Crop progress & condition report from USDA

    The Crop Progress and Condition Report includes degree days, air temperature, precipitation, crop planting progress, crop development and harvesting progress. This report is published weekly except for the winter months of December, January and February, when issued monthly.

  • Vegetation drought response index (VegDRI)

    VegDRI maps are produced every two weeks and provide regional to sub-county scale information about drought's effects on vegetation. The VegDRI calculations integrate satellite-based observations of vegetation conditions, climate data, and other biophysical information such as land cover/land use type, soil characteristics, and ecological setting. The National Drought Mitigation Center produces VegDRI in collaboration with the US Geological Survey, and the High Plains Regional Climate Center, with sponsorship from the US Department of Agriculture.

  • U.S. drought portal

    The U.S. Drought Portal provides current drought information, impacts, forecasts, and reports by state or region, along with supplemental tools to aid in education, planning, recovery, and research.

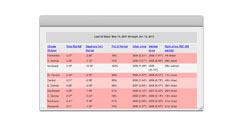
  • Daily report of reservoir conditions from the U.S. Army Corps

    The U.S. Army Corps maintains a daily report of reservoir conditions for each Oklahoma Basin.