Tornadoes & Severe Storms
Severe Weather Threat Climatology
 Tornado Days (1986-2015)
learn more
Tornado Days (1986-2015)
learn more
Tornado Days (1986-2015)
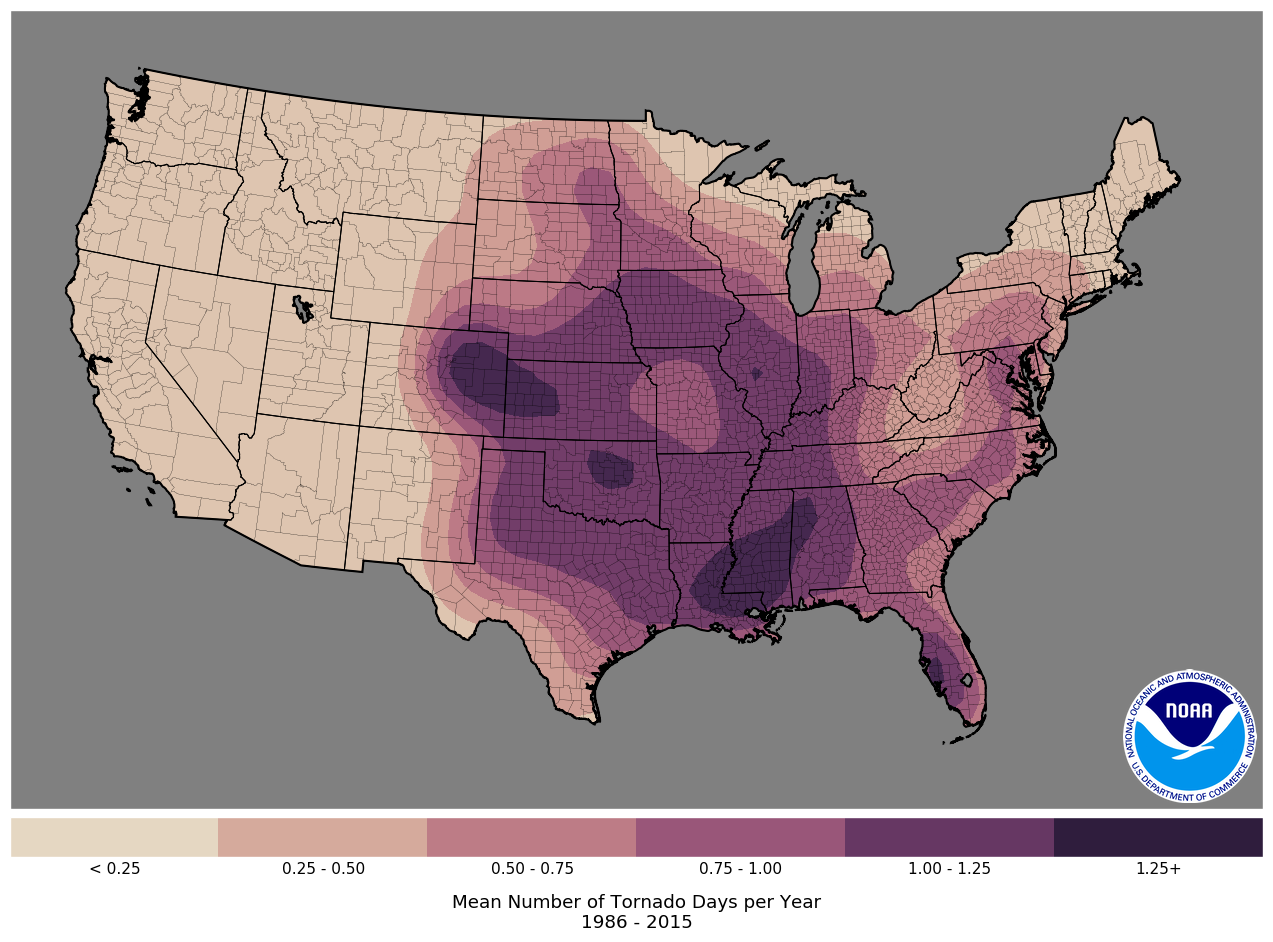
This map was created by the NWS Storm Prediction Center and shows the average number of tornado days per year (all magnitudes) from 1986-2015.
 EF1+ Tornado Days (1986-2015)
learn more
EF1+ Tornado Days (1986-2015)
learn more
EF1+ Tornado Days (1986-2015)
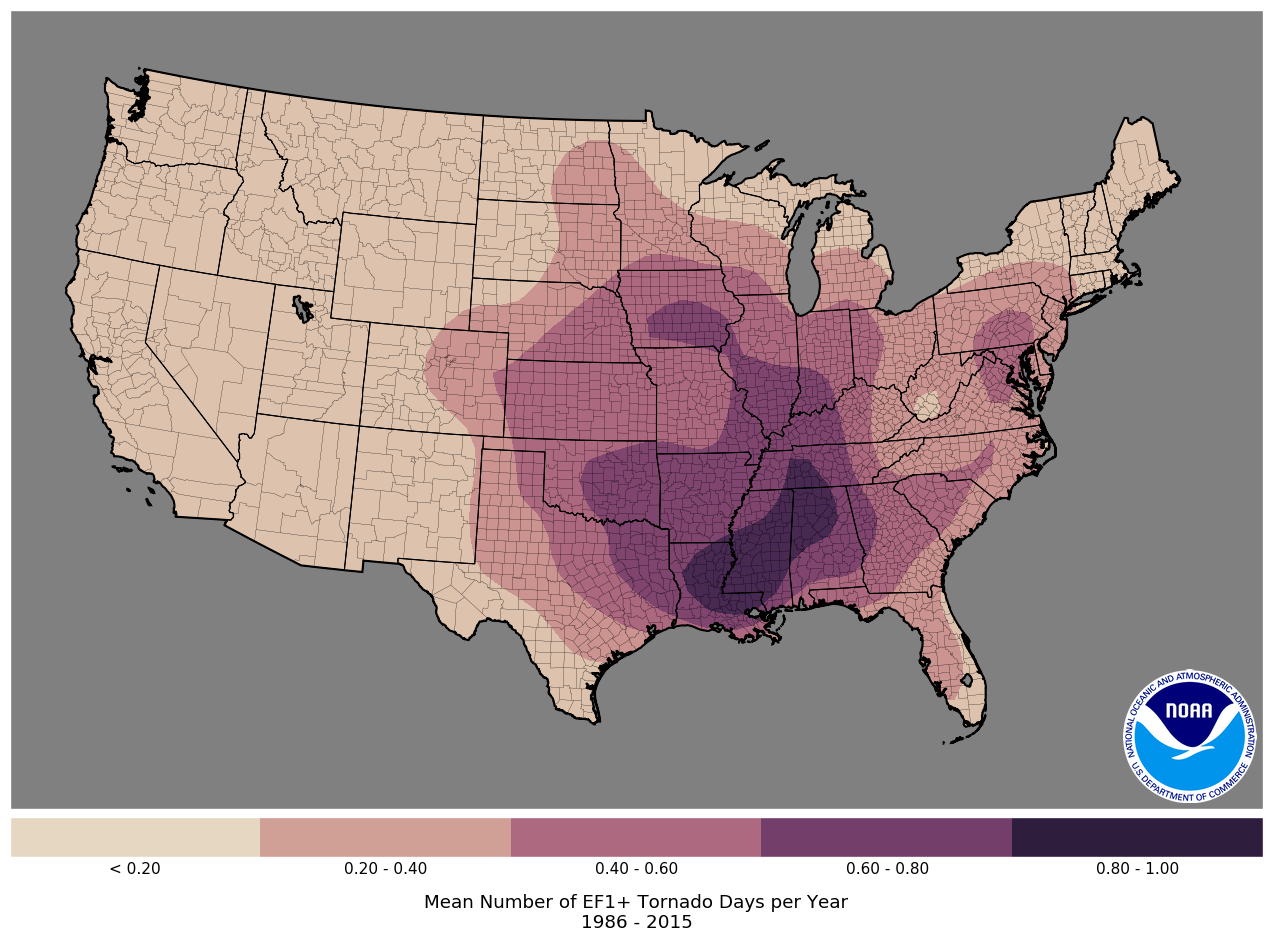
This map was created by the NWS Storm Prediction Center and shows the average number of EF1+ tornado days per year from 1986-2015.
 EF2+ Tornado Days (1986-2015)
learn more
EF2+ Tornado Days (1986-2015)
learn more
EF2+ Tornado Days (1986-2015)
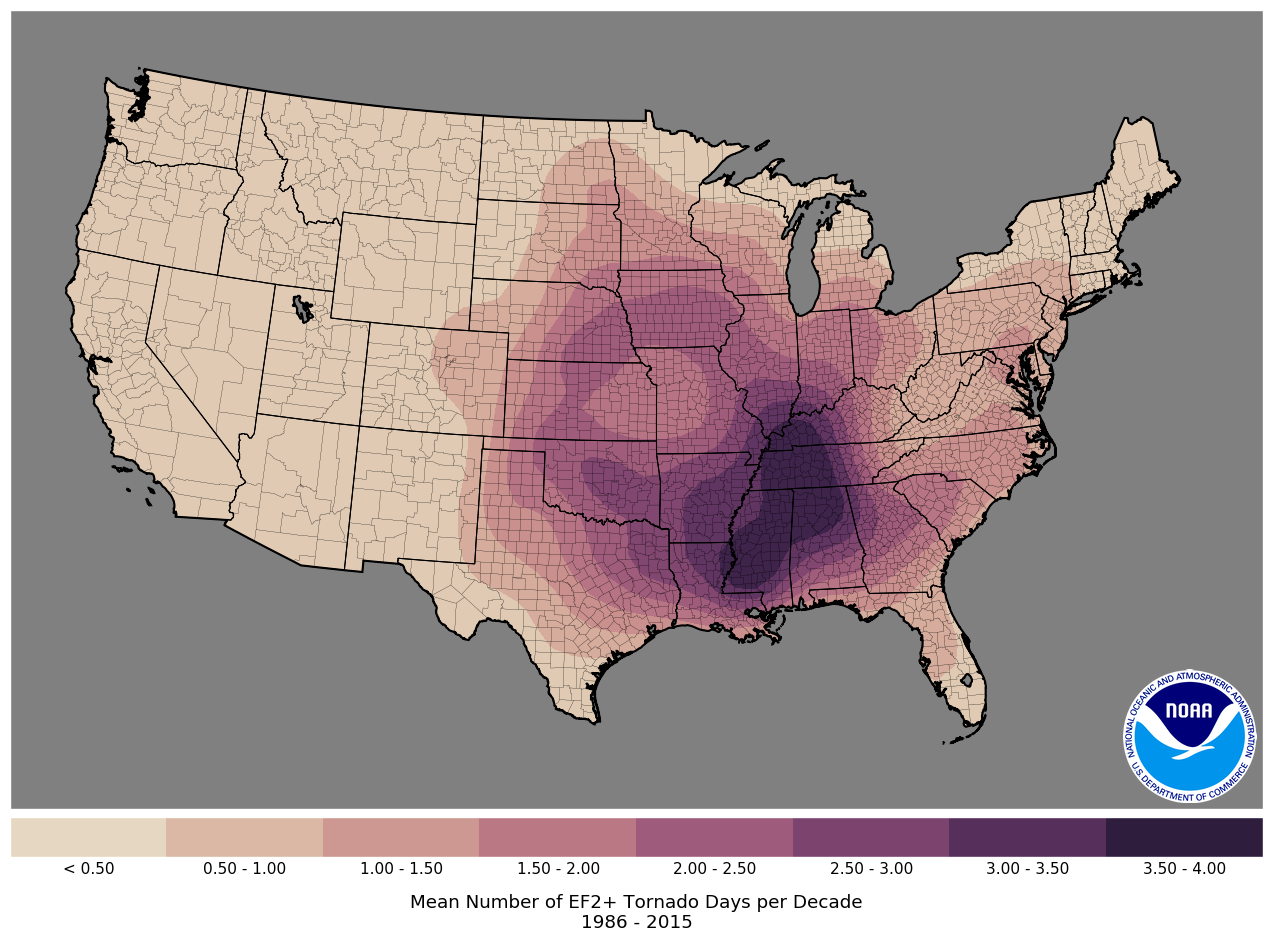
This map was created by the NWS Storm Prediction Center and shows the average number of EF2+ tornado days per decade from 1986-2015.
 EF4+ Tornado Days (1986-2015)
learn more
EF4+ Tornado Days (1986-2015)
learn more
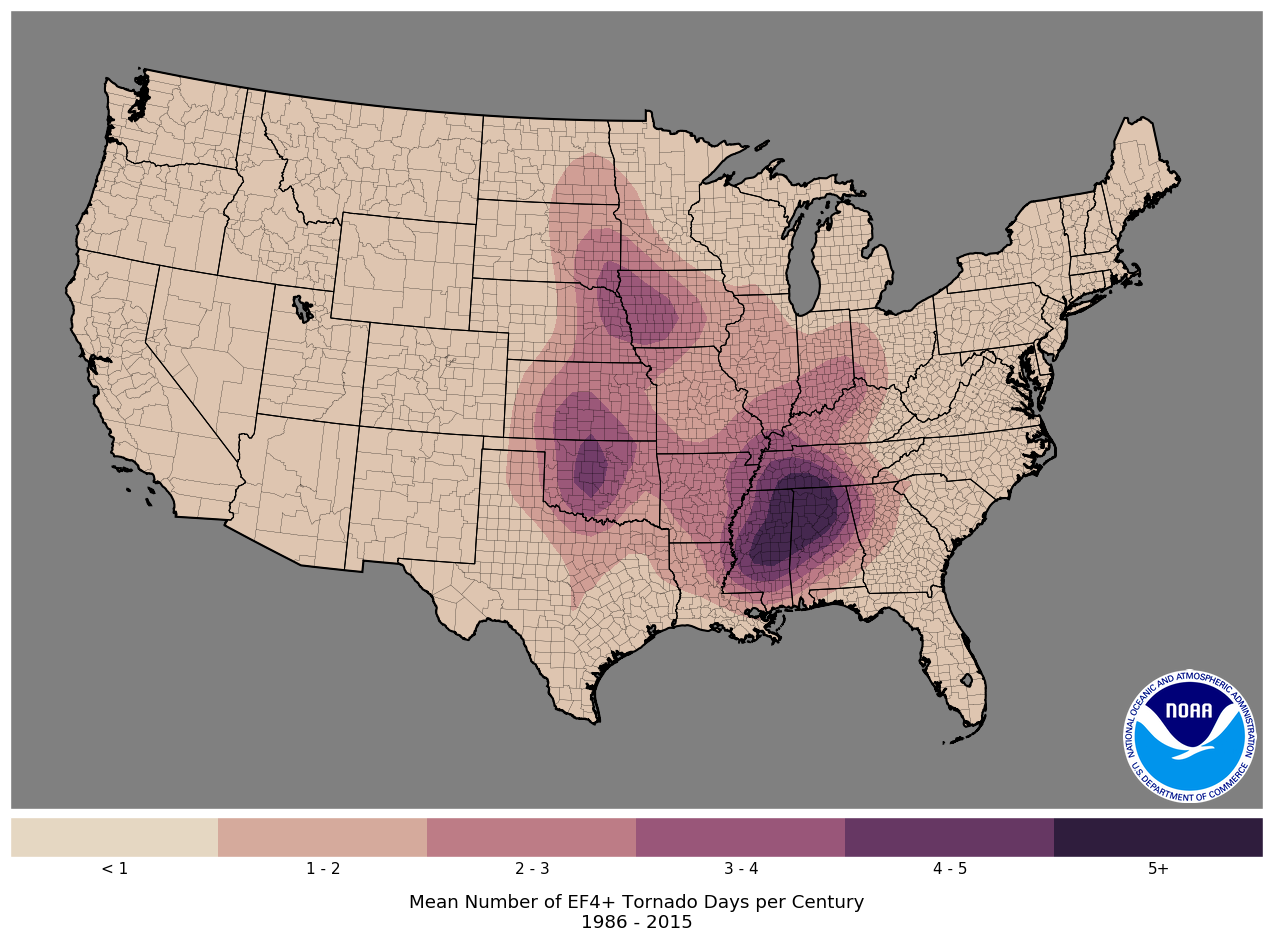
EF4+ Tornado Days (1986-2015)
This map was created by the NWS Storm Prediction Center and shows the average number of EF4+ tornado days per century from 1986-2015.
 1.00-Inch Hail Days (1986-2015)
learn more
1.00-Inch Hail Days (1986-2015)
learn more
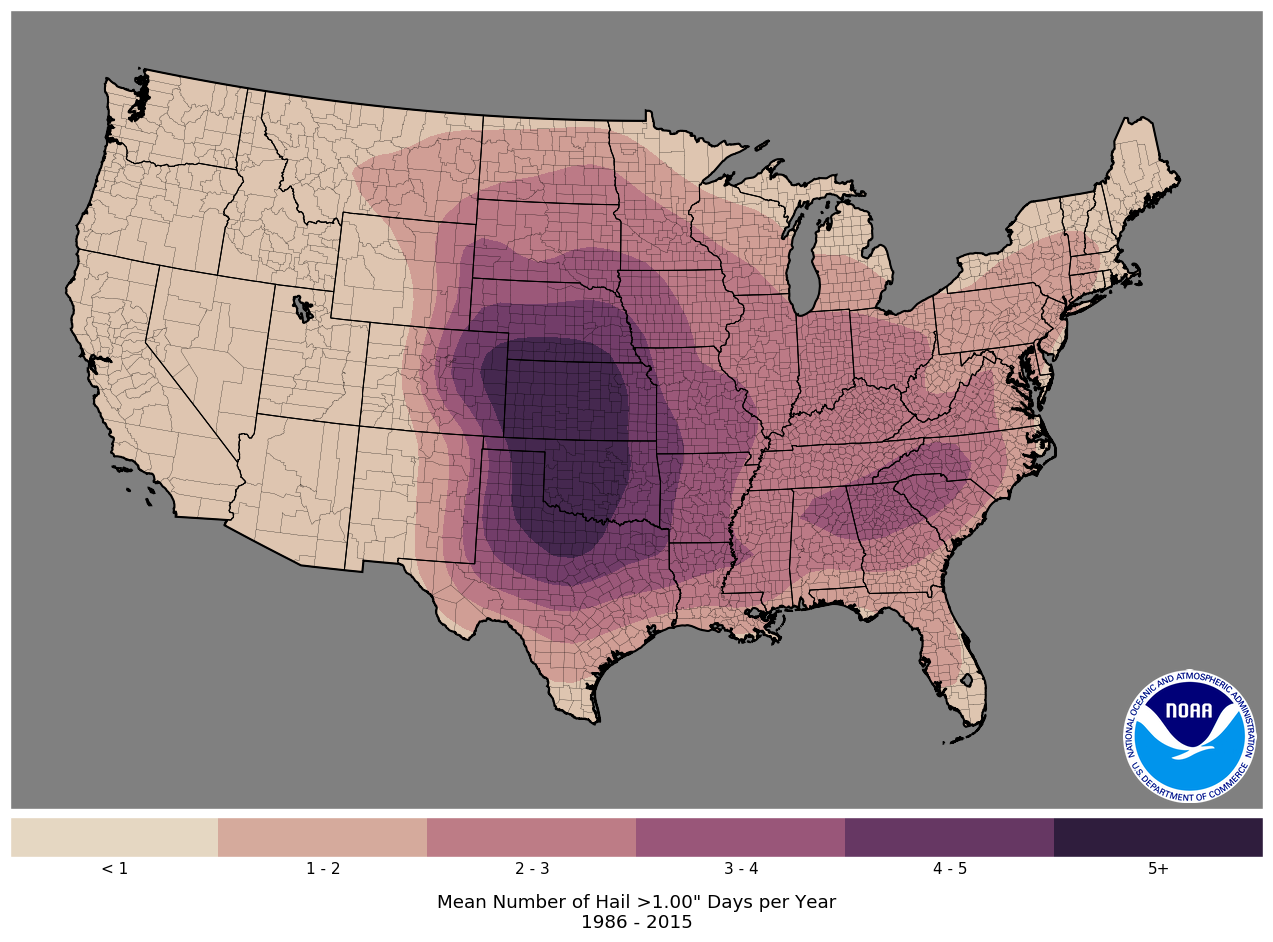
1.00-Inch Hail Days (1986-2015)
This map was created by the NWS Storm Prediction Center and shows the average number of greater than 1.00-inch hail days per year from 1986-2015.
 2.00-Inch Hail Days (1986-2015)
learn more
2.00-Inch Hail Days (1986-2015)
learn more
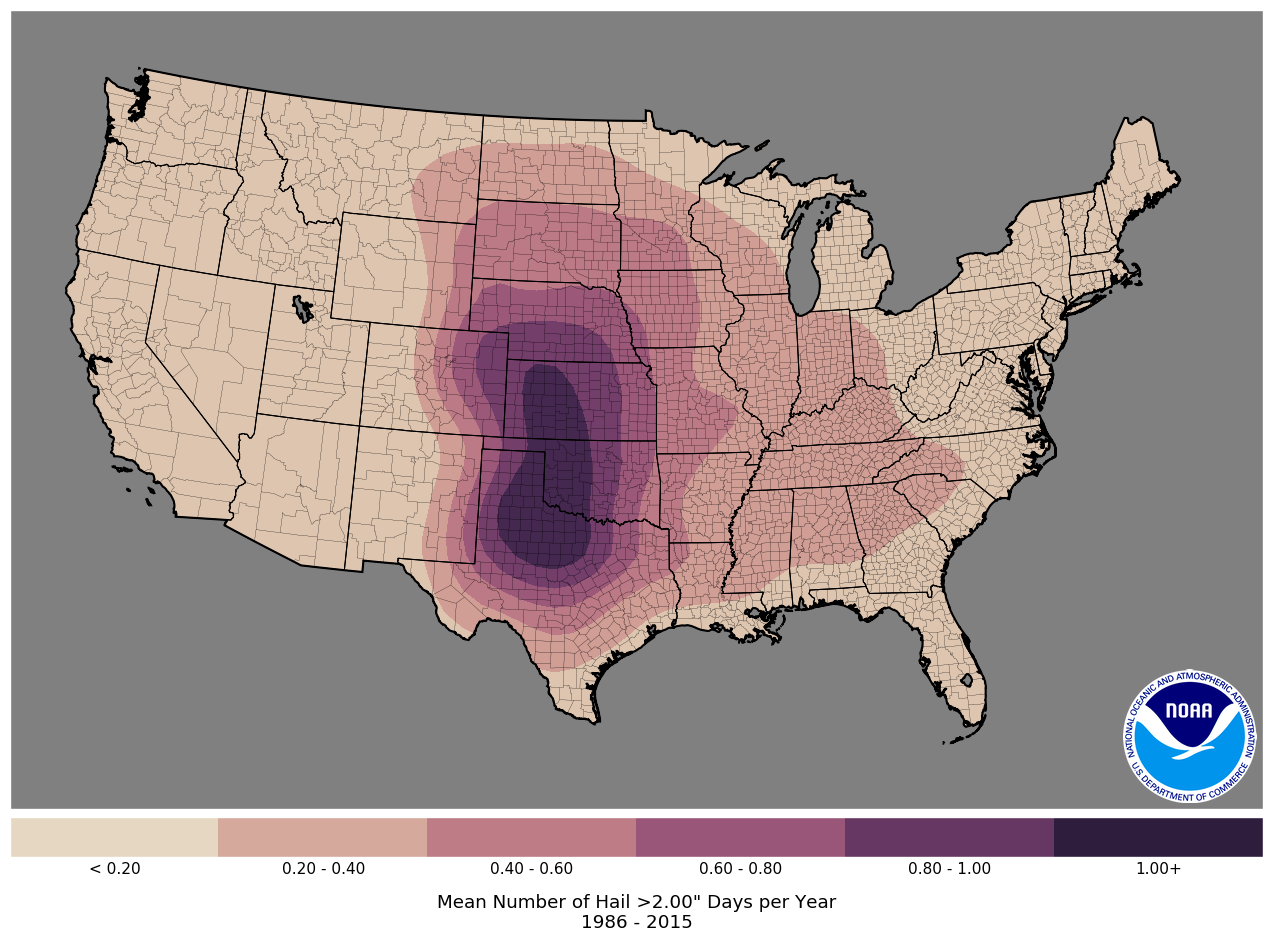
2.00-Inch Hail Days (1986-2015)
This map was created by the NWS Storm Prediction Center and shows the average number of greater than 2.00-inch hail days per year from 1986-2015.
 50-Knot Wind Days (1986-2015)
learn more
50-Knot Wind Days (1986-2015)
learn more
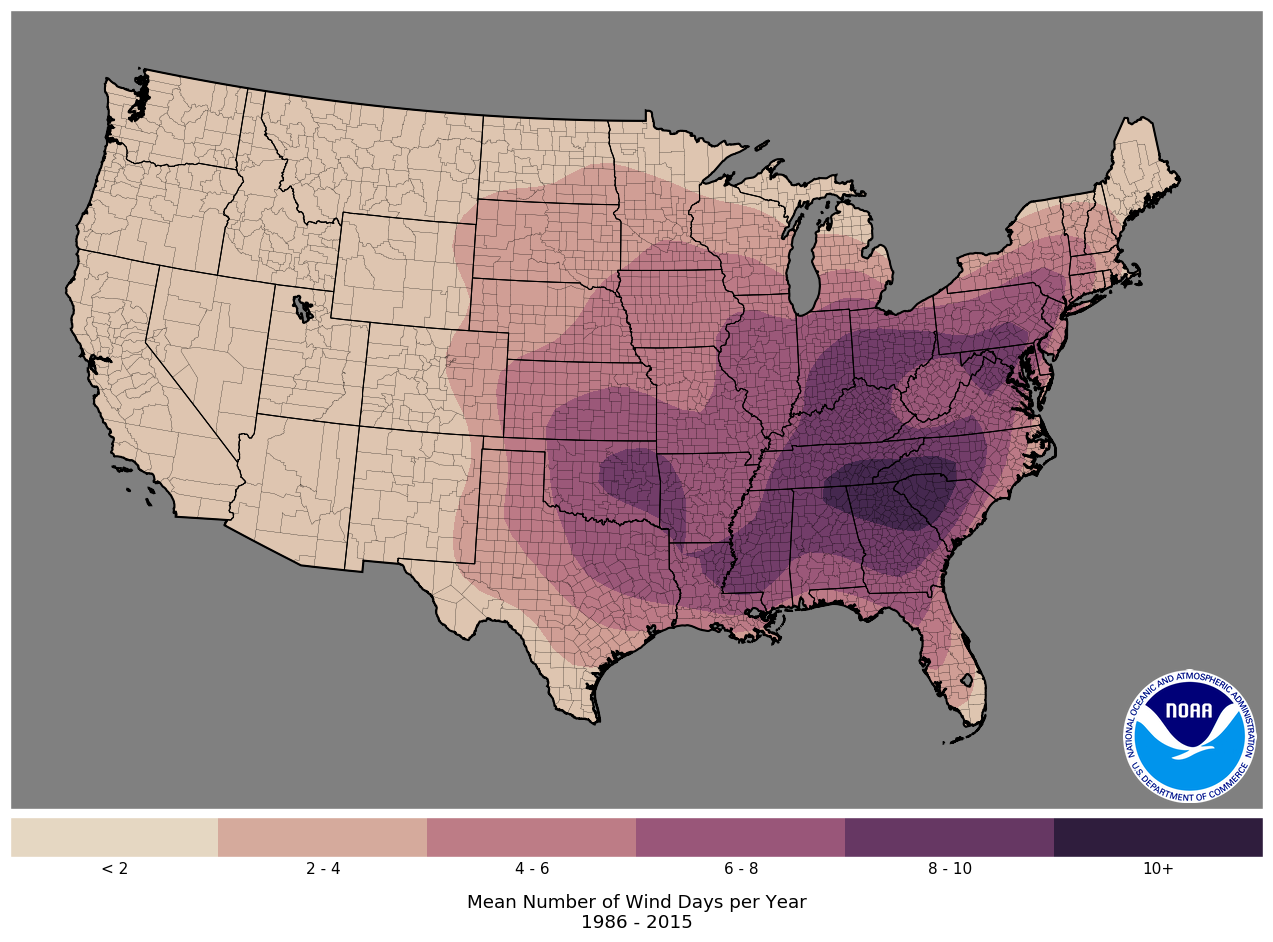
50-Knot Wind Days (1986-2015)
This map was created by the NWS Storm Prediction Center and shows the average number of greater than 50-knot wind days per year from 1986-2015.
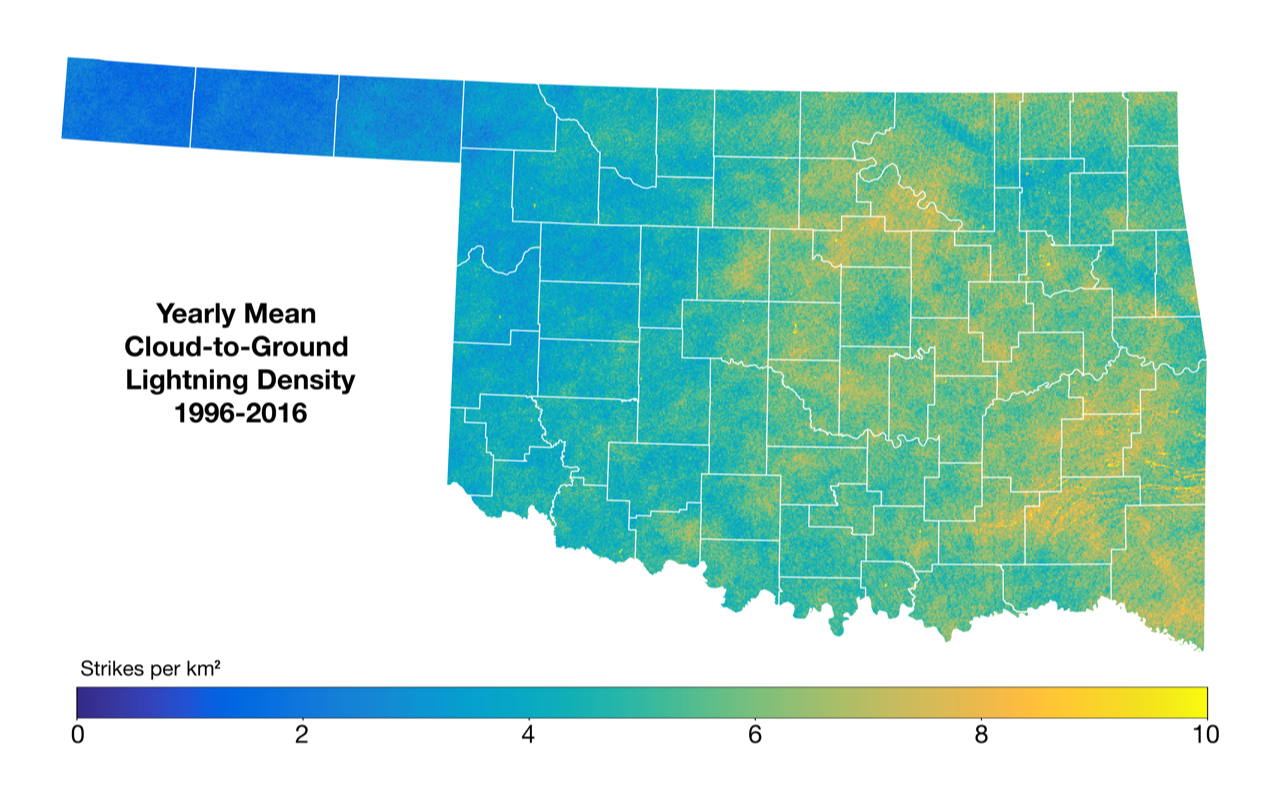 Yearly Lightning Density (1996-2016)
learn more
Yearly Lightning Density (1996-2016)
learn more
Yearly Lightning Density (1996-2016)
This map was created by Kristin Calhoun (National Severe Storms Laboratory and the Cooperative Institute for Mesoscale Meteorological Studies) and shows the yearly mean cloud-to-ground lightning density from 1996-2016 for Oklahoma. The color scale represents the density of strikes per kilometer squared. The data have been provided by the Vaisala National Lightning Detection Network.
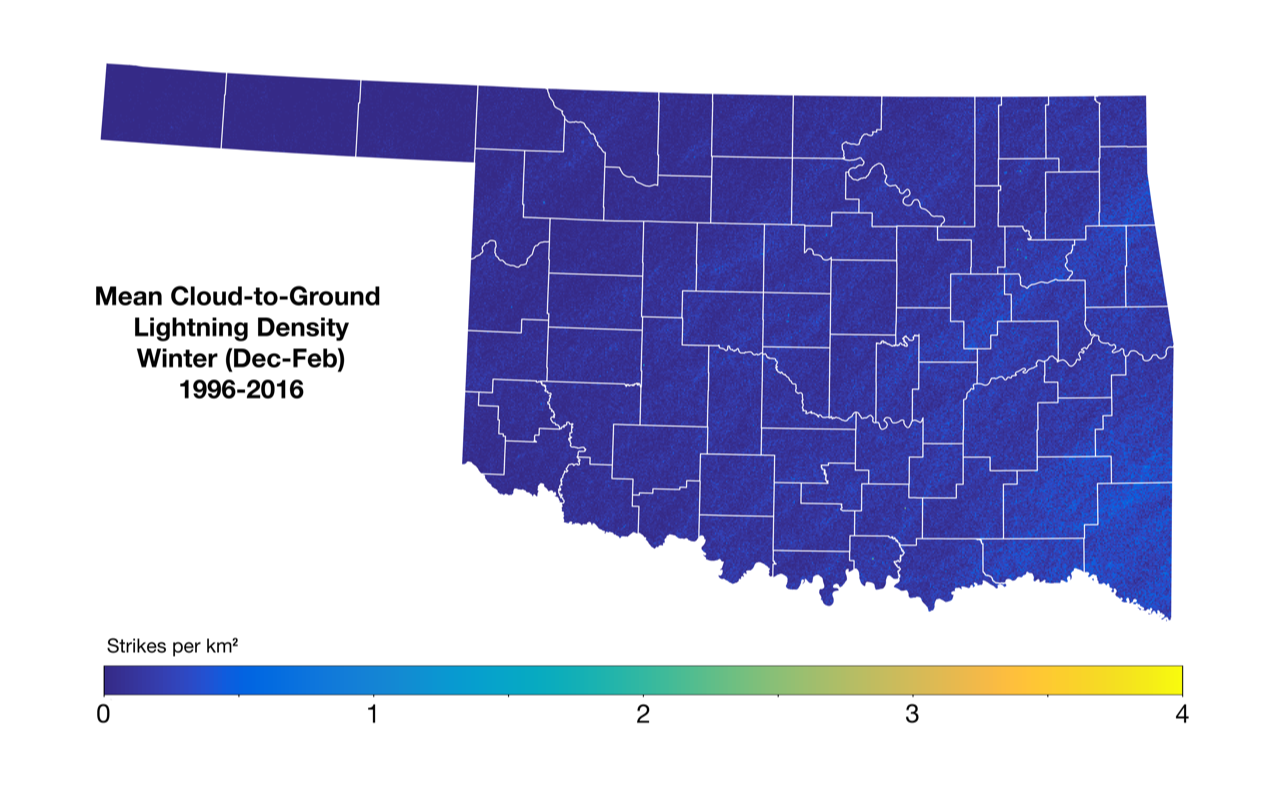 Winter Lightning Density (1996-2016)
learn more
Winter Lightning Density (1996-2016)
learn more
Winter Lightning Density (1996-2016)
This map was created by Kristin Calhoun (National Severe Storms Laboratory and the Cooperative Institute for Mesoscale Meteorological Studies) and shows the mean cloud-to-ground lightning density for the winter season (December-February) from 1996-2016 for Oklahoma. The color scale represents the density of strikes per kilometer squared. The data have been provided by the Vaisala National Lightning Detection Network.
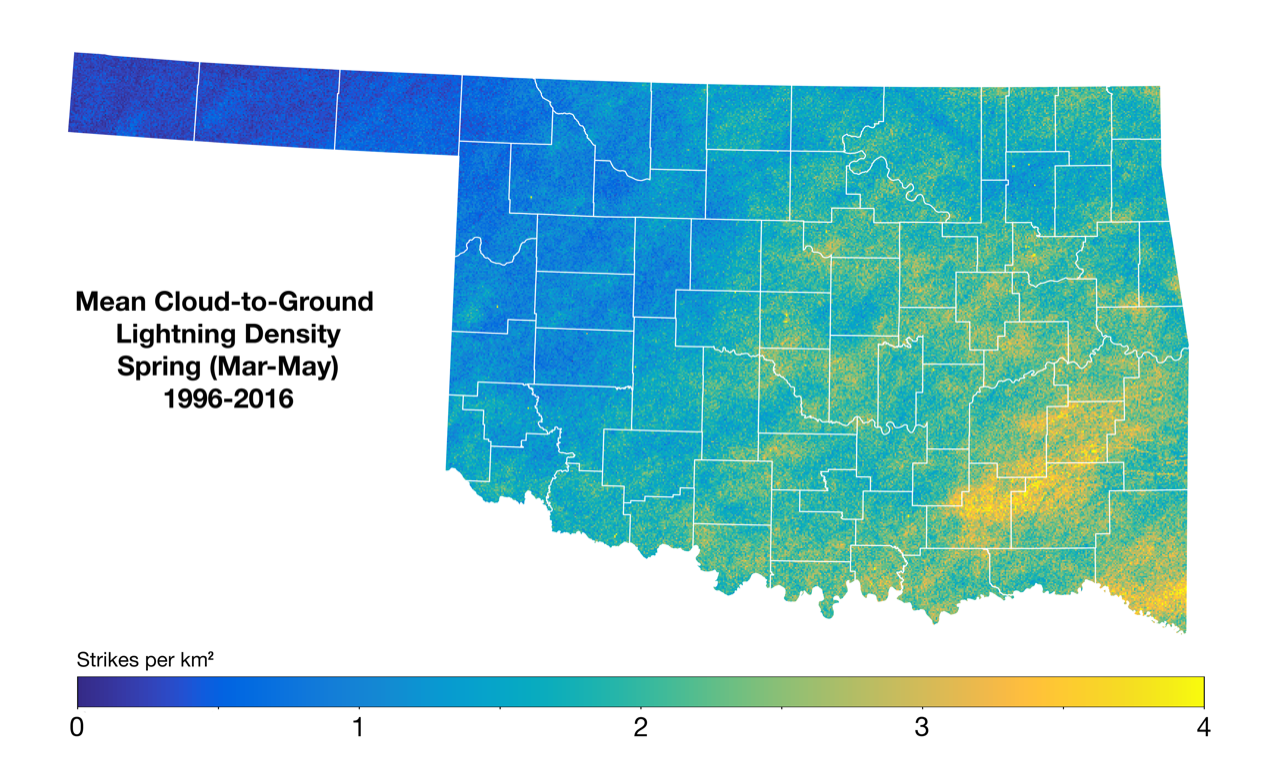 Spring Lightning Density (1996-2016)
learn more
Spring Lightning Density (1996-2016)
learn more
Spring Lightning Density (1996-2016)
This map was created by Kristin Calhoun (National Severe Storms Laboratory and the Cooperative Institute for Mesoscale Meteorological Studies) and shows the mean cloud-to-ground lightning density for the spring season (March-May) from 1996-2016 for Oklahoma. The color scale represents the density of strikes per kilometer squared. The data have been provided by the Vaisala National Lightning Detection Network.
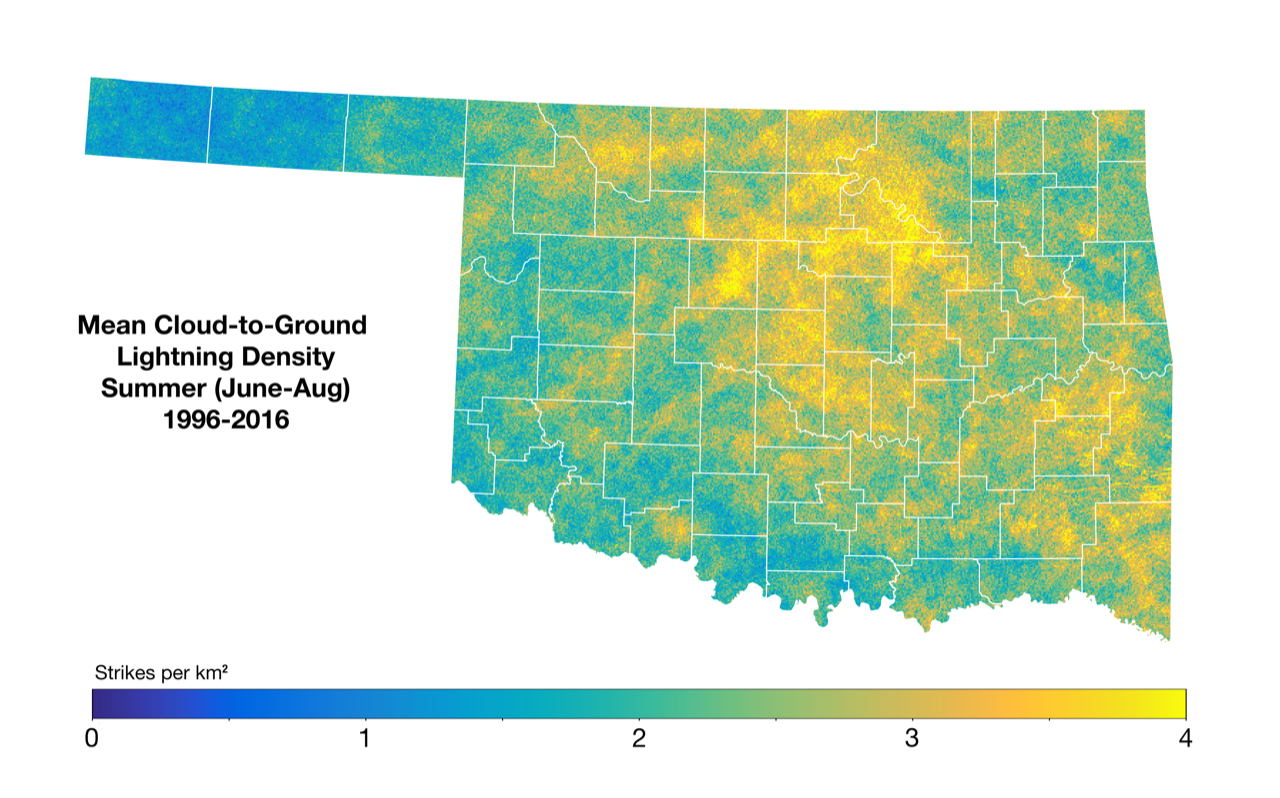 Summer Lightning Density (1996-2016)
learn more
Summer Lightning Density (1996-2016)
learn more
Summer Lightning Density (1996-2016)
This map was created by Kristin Calhoun (National Severe Storms Laboratory and the Cooperative Institute for Mesoscale Meteorological Studies) and shows the mean cloud-to-ground lightning density for the summer season (June-August) from 1996-2016 for Oklahoma. The color scale represents the density of strikes per kilometer squared. The data have been provided by the Vaisala National Lightning Detection Network.
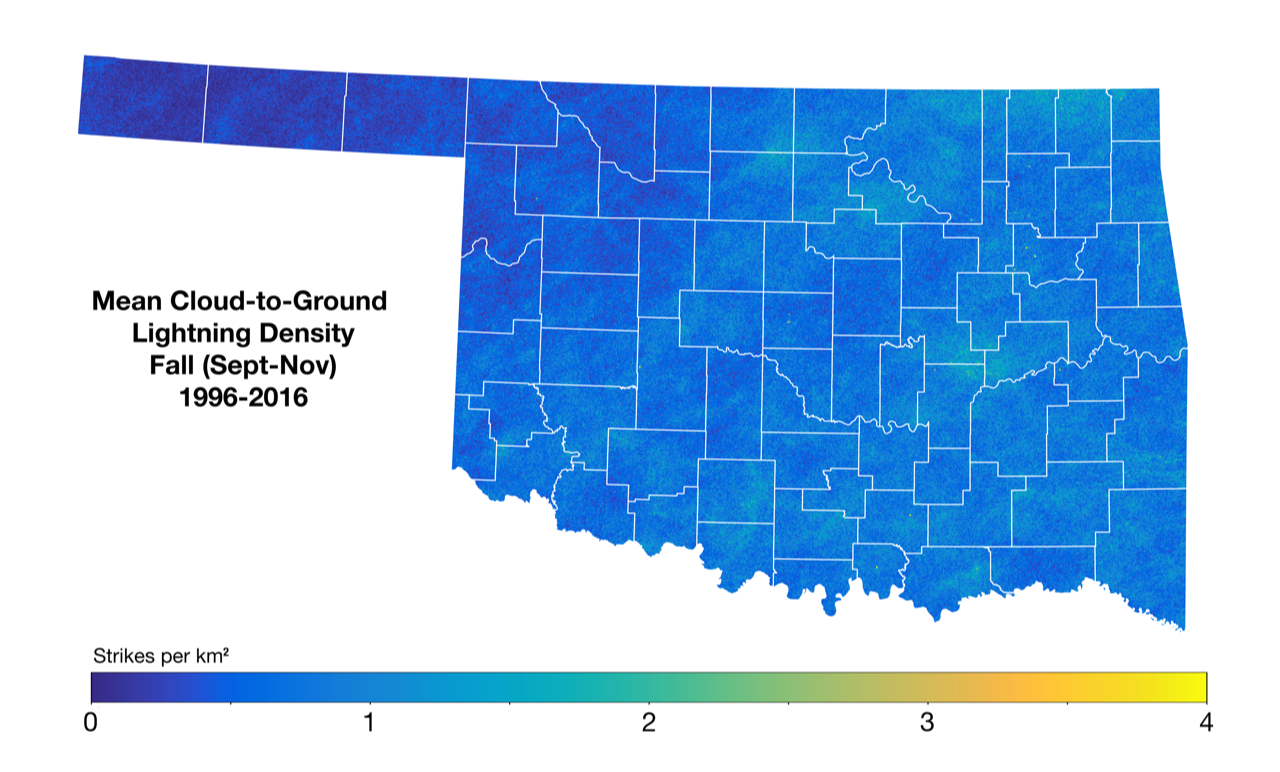 Fall Lightning Density (1996-2016)
learn more
Fall Lightning Density (1996-2016)
learn more
Fall Lightning Density (1996-2016)
This map was created by Kristin Calhoun (National Severe Storms Laboratory and the Cooperative Institute for Mesoscale Meteorological Studies) and shows the mean cloud-to-ground lightning density for the fall season (September-November) from 1996-2016 for Oklahoma. The color scale represents the density of strikes per kilometer squared. The data have been provided by the Vaisala National Lightning Detection Network.
Other Tornado & Severe Storm Products
-
More products from the Storm Prediction Center
Additional products are available from the Storm Prediction Center that encompass a variety of weather information and forecasts.
-
Archived storm reports from the Storm Prediction Center
The Storm Prediction Center provides an archive of outlooks, watches, mesoscale discussions, and reports.The archive covers a period from January 23, 2003 through today.
-
Storm events database from the National Climatic Data Center
The Storm Events Database provides archived severe weather events (e.g., hail, high winds, blizzard) for a specified state, county, and date range. Search results can be further refined to include size, wind speed, property damage, crop damage, number of deaths, and number of injuries depending on the selected event.